
Combining Cumul.io’s embedded analytics platform with a hotglue Quickbooks data integration pipeline
Often, companies want to use data they have to analyze trends. For example, if you want to look at accounting trends, common questions are:
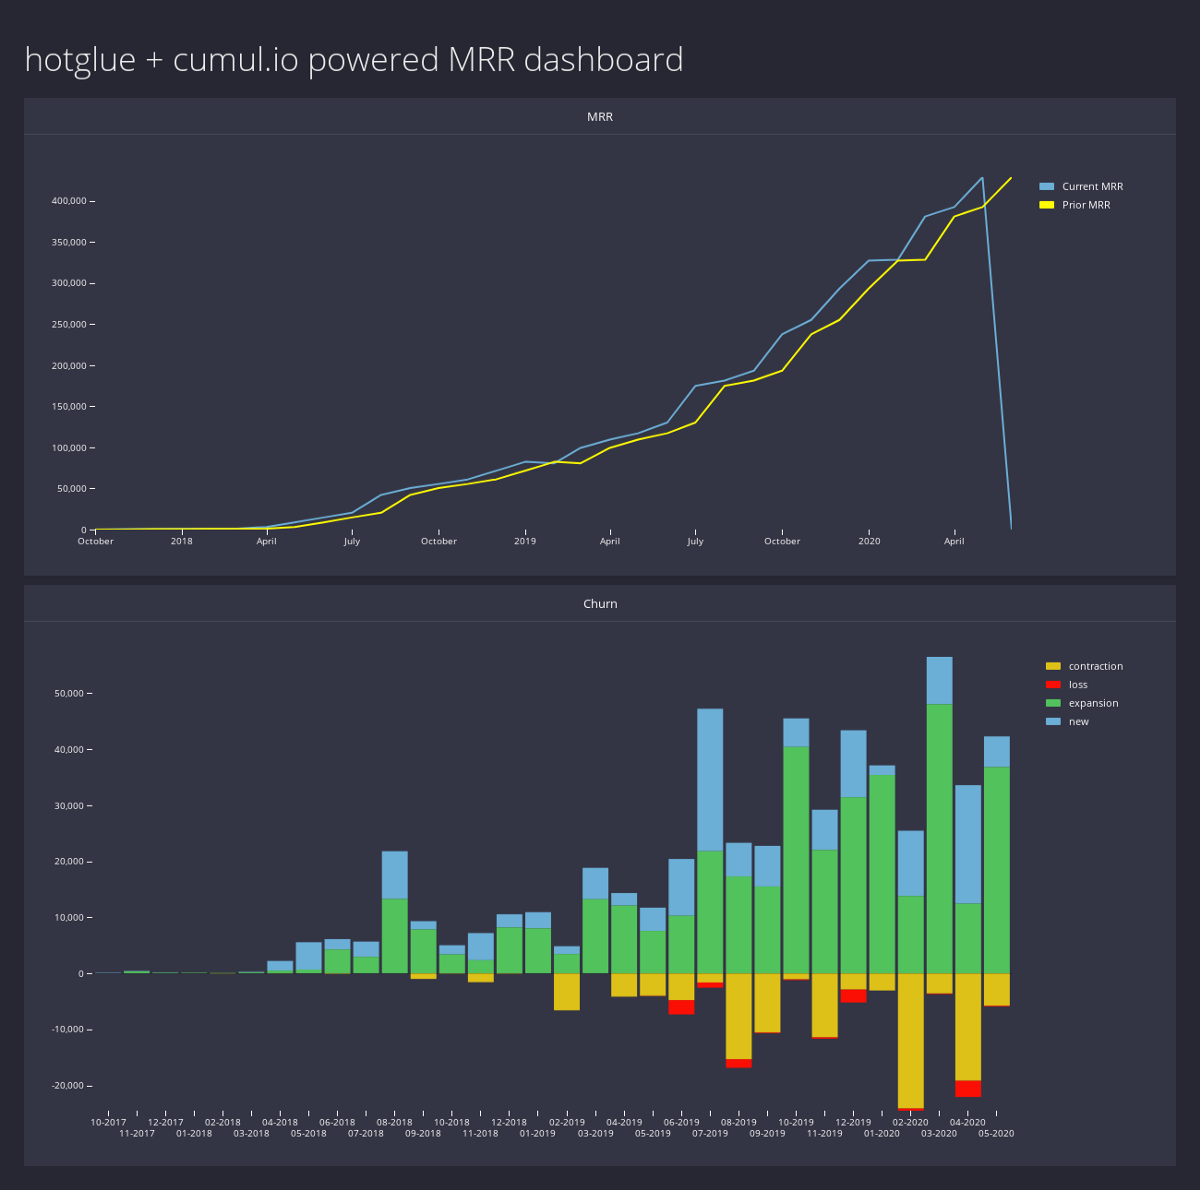
- how is my monthly recurring revenue (MRR) trending?
- what does the churn look like this month? what about last month?
Whether you are building a SaaS platform that analyzes customer data, or you are analyzing internal company data, Cumul.io and hotglue can help.
In this article, we will use hotglue to pull Invoice data from Quickbooks, process that data using a Python script, and push it to a PostgreSQL database. From there, we’ll use Cumul.io to create the interactive dashboard pictured to the left and embed it directly into a website.
Let’s jump in!
See the live demo
Before we begin, you can see and interact with a live demo of the final product here, and view the source directly on GitHub.
Get the data from Quickbooks
In hotglue, each “type” of data you need you want to import is called a flow. For this article, we want to import Invoices from an ERP like Quickbooks, so we’ll create an Invoices flow. Each flow has a set of sources and targets, both of which are fully configurable. Our Invoices flow will have a Quickbooks source, and a PostgreSQL target.
For brevity, I will omit the process of creating a hotglue flow — feel free to watch a tutorial or read about this process in detail on the hotglue docs.
Configure the Quickbooks
Let’s start by configuring the Quickbooks source. To do this, you will need to create an OAuth app on Quickbooks and save your client id and client secret and provide it to hotglue.
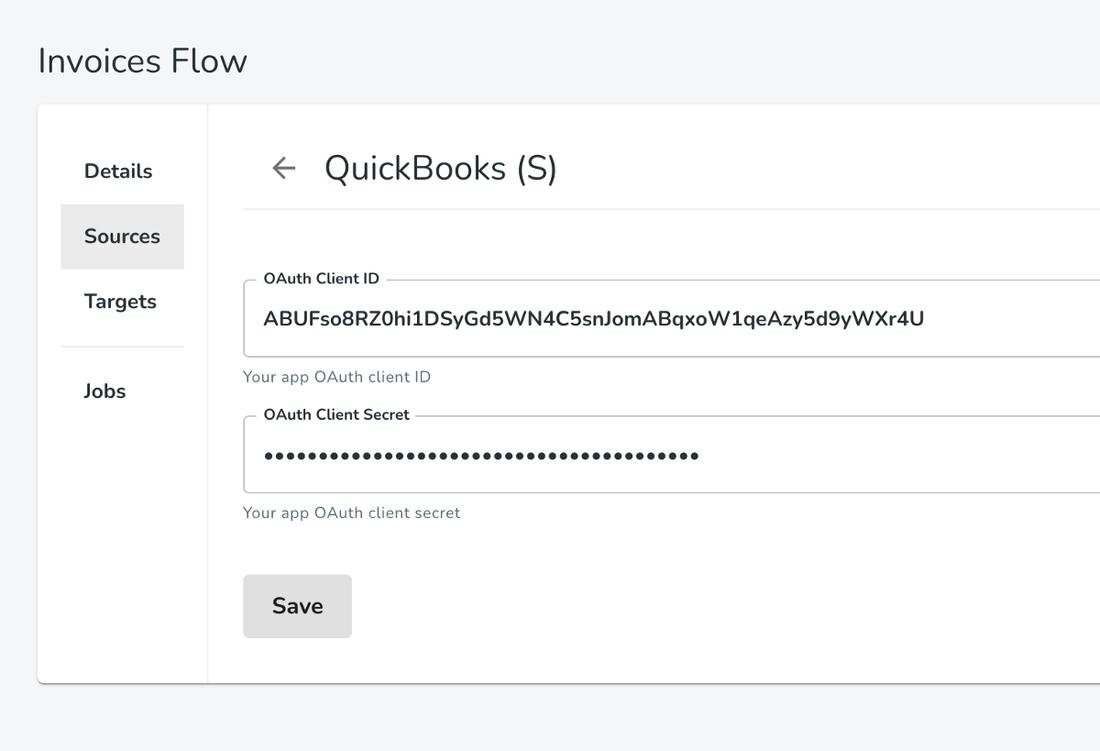
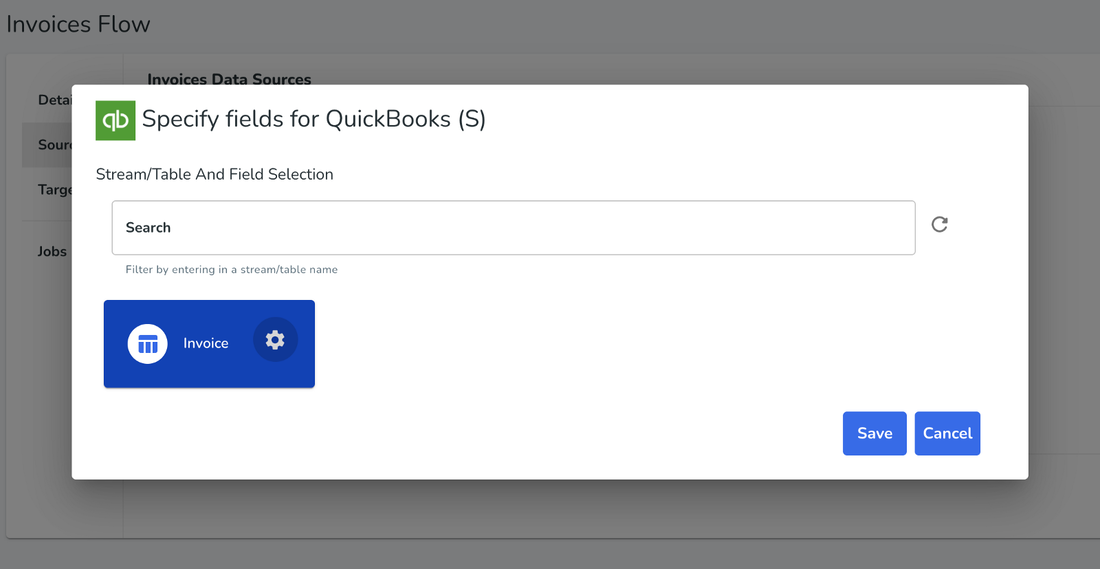
Once you provide these credentials and login with your Quickbooks account, we can select what data we want. Since we only care about invoices to monitor MRR that’s the only thing we select.
Configure the PostgreSQL target
Since Cumul.io has native support for PostgreSQL, we’ll select that as our target.
hotglue PostgreSQL configurationThis process is quite straightforward, just provide your database access credentials to hotglue — don’t worry about table names here.
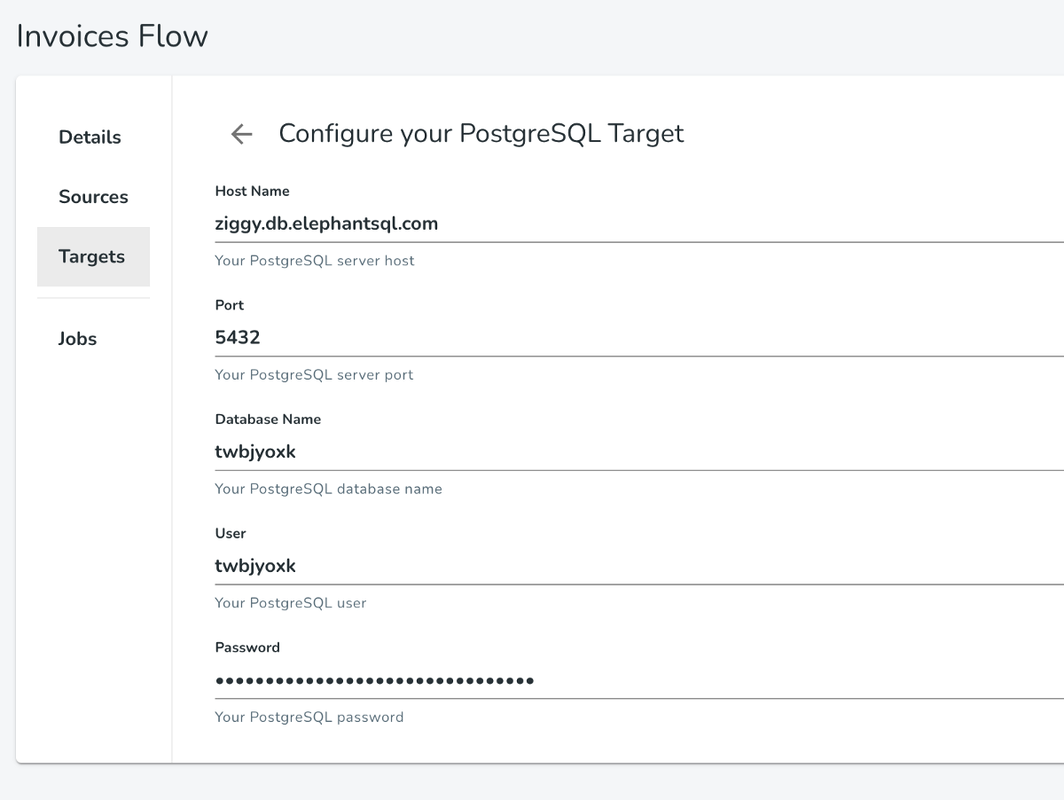
If you’d like to follow along with this article but don’t have a PostgreSQL database, you can provision one for free from ElephantSQL.
Process the data
Great! Now that the flow is configured we can process the invoice data from Quickbooks to produce the MRR and churn metrics. hotglue provides a JupyterLab workspace directly in the admin panel, which is where I’ll be writing this script. The script will automatically run whenever new data is synced from Quickbooks, so our Cumul.io dashboard will always be up to date!
Start Jupyter
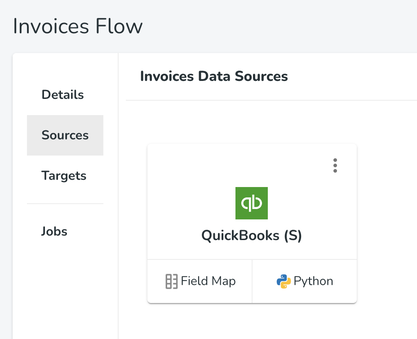
Launch Jupyter directly from hotglue by selecting the Python option under the Quickbooks source we configured earlier.
Write the script
If you’re not very technical, you can get the script I’ll use in this article from GitHub below. The script produces two CSV files — a churn.csv and mrr.csv.
Note: For this example, I am using the table names “churn” and “mrr” — if you wish to use different ones, merely change the name of the output files.
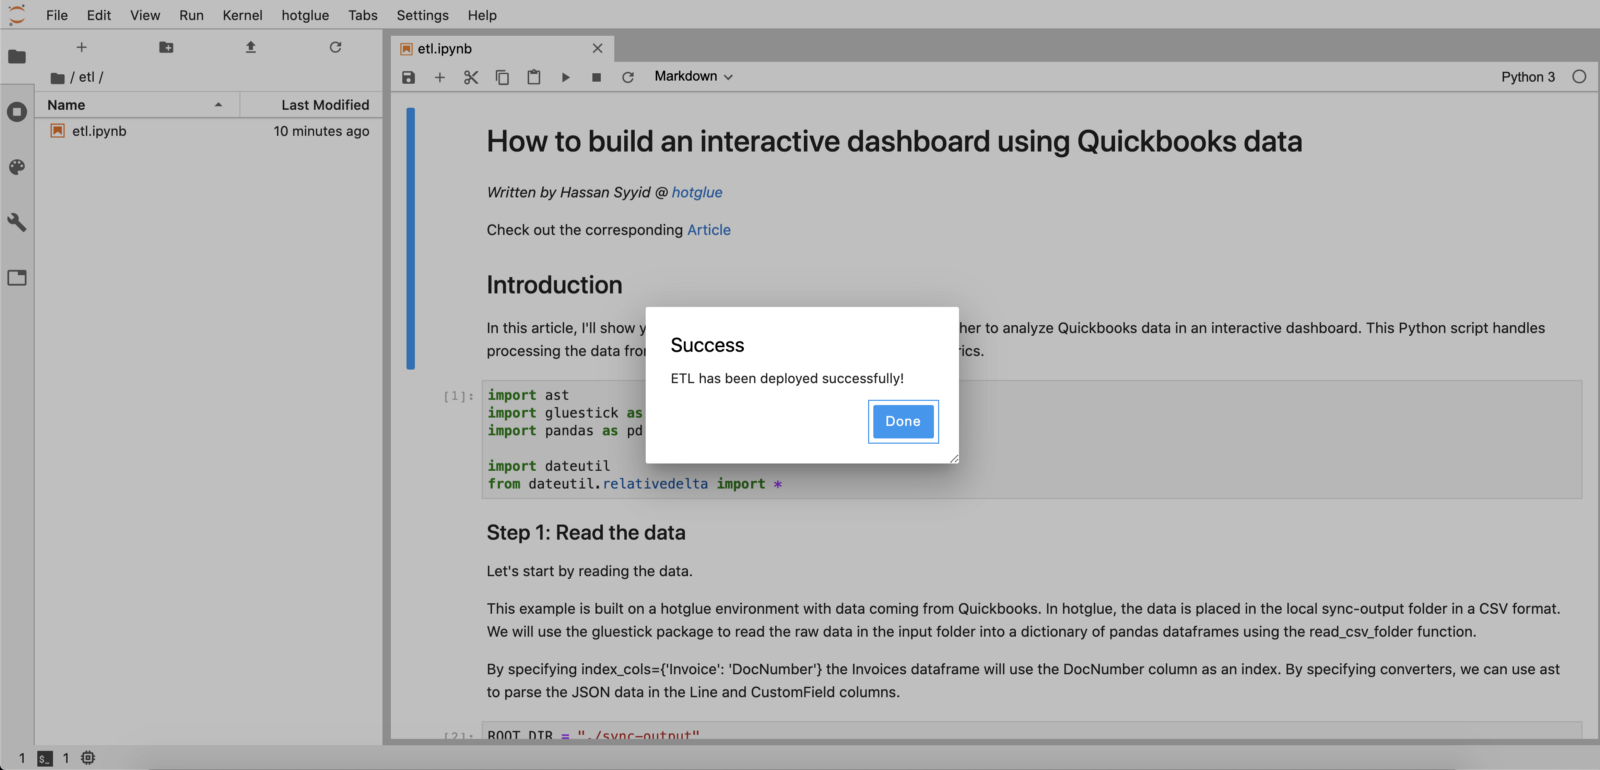
Once you’re done, you can deploy the script to hotglue directly via JupyterLab using the hotglue option in the toolbar.
Create the Cumul.io dashboard
Create the tables in PostgreSQL
Before we start creating the Cumul.io dashboard, let’s configure our PostgreSQL database a bit more by creating the tables we want to use.I’ll create an mrr and churn table like so:
CREATE TABLE mrr(
Month DATE PRIMARY KEY,
MRR_Curr double precision,
MRR_Pri double precision
);
``
CREATE TABLE churn(
Month DATE PRIMARY KEY,
New double precision,
Expansion double precision,
Loss double precision,
Contraction double precision
);
``
Add the datasets in Cumul.io
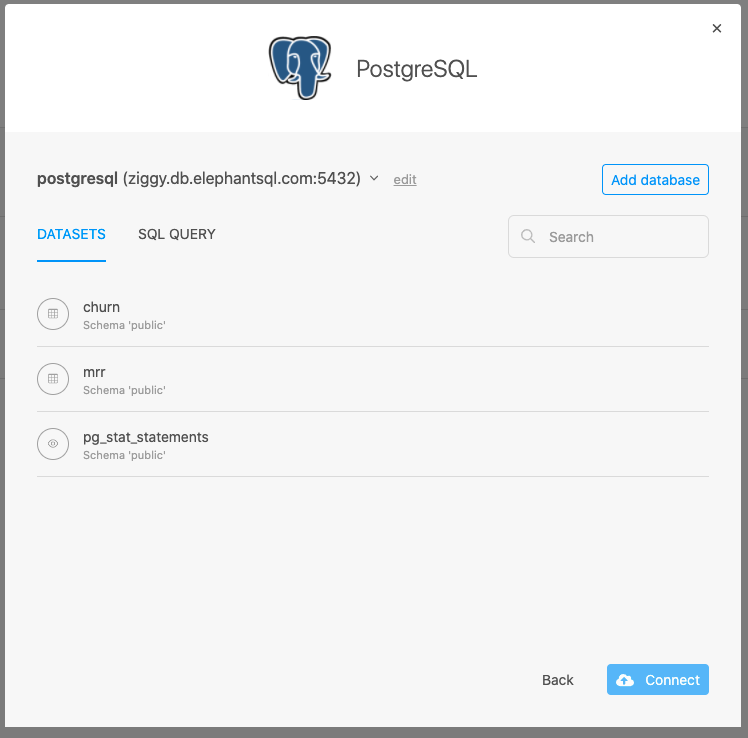
In Cumul.io, we’ll configure the PostgreSQL connector by providing our database credentials (just like we did with hotglue).
Cumul.io PostgreSQL configurationIf everything goes well, our two new tables should appear in the options for datasets. Simply connect both churn and mrr, and we are good to go!
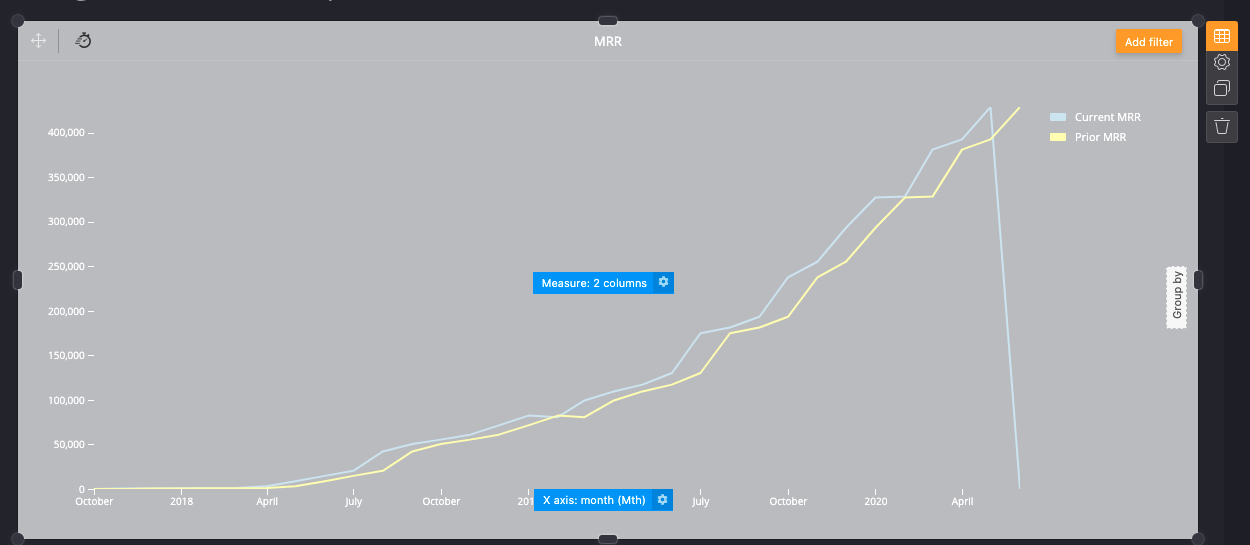
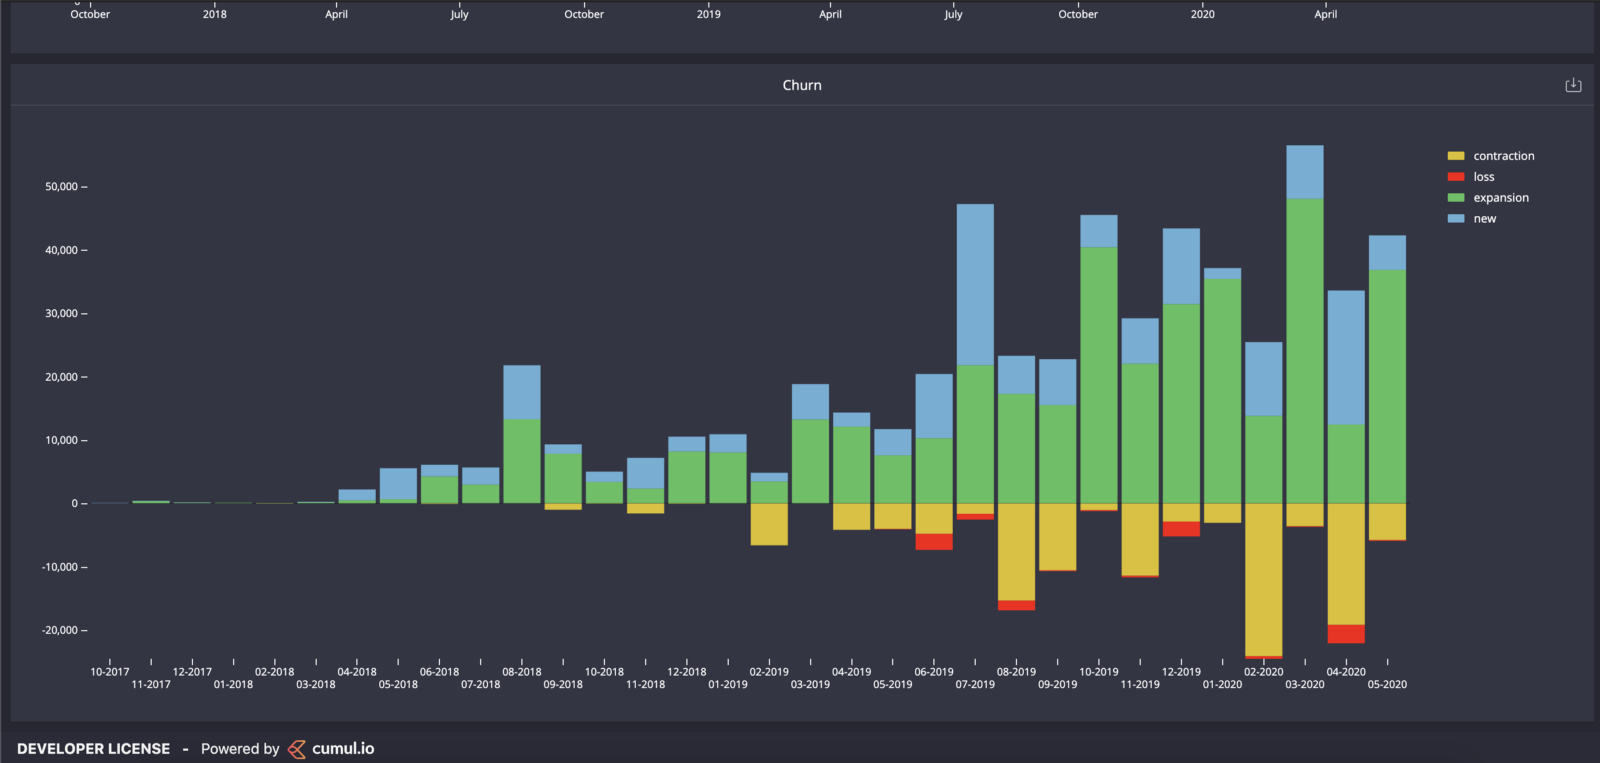
From here, we’ll create a new dashboard in Cumul.io and add two items: a line chart to analyze MRR trends, and a stacked box plot to analyze Churn trends.
From there we can connect our mrr and churn datasets, respectively. The x-axis for both charts should be month and the y-axis should be the other columns.
Embed hotglue and Cumul.io
Now to the fun part! Let’s embed hotglue and Cumul.io into the same web app to get a great experience.
In Cumul.io, select the share icon at the top of your dashboard and follow their embed instructions. You’ll need to follow their developer documentation to generate an authorization token that grants access to your datasets and dashboard. To get more details, read the Cumul.io docs.
Embedding hotglue follows a similar process — access the embed instructions directly from settings. To get more details, read the hotglue docs.
Once you have both embedded, let’s populate our Cumul.io dashboard. Simply open the hotglue widget, connect the Quickbooks source by logging, and press run job.
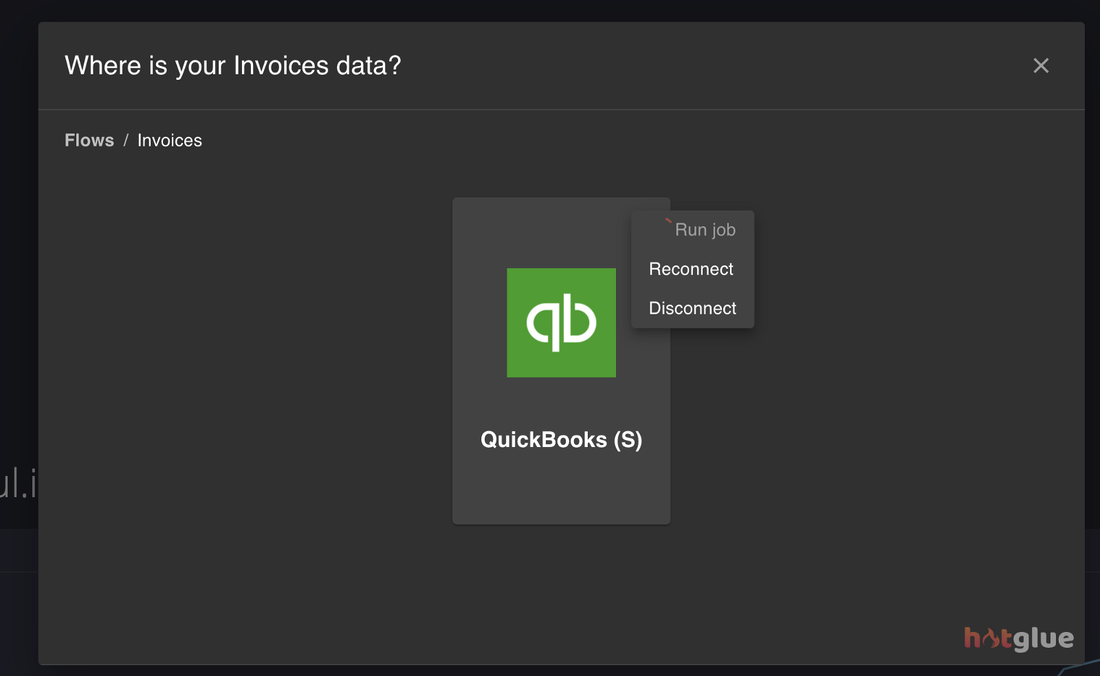
This will tell hotglue to sync any invoice data from Quickbooks, run our script, and output the data to PostgreSQL.
Once the job completes, we can see our Cumul.io dashboard update!
That’s all there is to it! Whenever you get new invoices you can just run another hotglue job and the data will update automatically in your Cumul.io dashboard — you can even set a sync schedule so it stays up to date automatically.
Conclusion
By combining Cumul.io’s powerful embeddable analytics with hotglue’s data integration platform, we are able to connect, process, and analyze data from virtually any data source!
Want to see the whole thing in action? Check out the demo video and the live site!
Thanks for reading! Feel free to leave comments and questions below.